
How to measure brand value
Arguably the most valuable asset in consumer facing businesses is its brand. A strong brand encourages choice over competitors, and with this revenue and earnings (and or other key metrics). When businesses are brought and sold, the goodwill associated with the brand value is often critical in the sale.
The Forbes list of The World’s Most Valuable Brands has been conducted since 2010, and lists 100 brands that are the most valuable from their calculations, based on financial data. The list uses financial data to measure brand value.
“How do you measure the value of a brand? At Forbes, we look at the financial numbers. The most valuable brands are ones that generate massive earnings in industries where branding plays a major role.” Forbes
Measuring a brand’s value could be as simple as the earnings able to be generated by the brand, and category benchmarks established by making same calculation for competitors. However, often appropriate data is not easily available, and there are complexities making such measures muddled.
In an accounting sense, brand equity is an intangible asset, because it is not a physical asset and is more so determined by the consumer perceptions of the brand, yet has a major contribution to the overall valuation of the business’ company assets as a whole.
“Positive brand equity is achieved when consumers are willing to pay more for a product with a recognizable brand name than they would pay for a generic version of the product. In contrast, a brand’s equity is considered to be negative when consumers are not willing to pay extra for a brand name version of a product.” Investmentopedia
Brand equity influences the ease to attract customers. However, financial measures of brand value are limited, as there can be a lag between building brand equity and revenue. A successful marketing campaign may build brand awareness and other measures, yet this may not have an immediate and/or sustained impact on revenue and earnings.
The challenge is that a brand is predominately in the minds of consumers. The value or equity in a brand is often underestimated, or more so, over estimated internally by the marketing team and leadership, without accurate measures of consumer perceptions of the brand. The team and its leaders live and breath the brand on a day to day basis, assumption can be made that real consumers are similarly connected. Assumption is made that marketing activity has a direct correlation with brand equity, but this is typically not the case. It is far more complex.
In reality, consumers are forgetful and hard to influence. Even brands as strong as Cadbury and Coca-Cola do not have universal awareness. Depending on the market category, brand visibility, advertising spend and a variety of other factors, brand awareness may be anywhere from 0–90%, and typically on the lower end of the scale. This can have a major influence on consumer choice of one brand over another.
It is also hard to predict how well a brand is known and understood, differentiated and valued. Is there brand confusion or a lack of distinctiveness? Would consumers trust and pay more, or purchase more frequently, from one category brand to another?
Herein lay a critical role of professional market research. Still the most robust way to measure brand value, beyond revenue and earning, is to identify the perceptions of consumers via a representative survey of the target market (or markets). Below are four key key measures available through surveys to give a reality check on brand equity and value.
1. Awareness
It might seem obvious, but without awareness a brand is invisible. Be this …
A. spontaneous awareness from a survey as to brand coming to mind in the category (i.e. first brand to mind, and others able to name);
B. prompted awareness of brands from a list in competitors; and/or
C. direct prompting of the specific brand (or even prompting with the logo) …
“Have you heard of Brand X?”
Awareness is a critical measure of brand equity and value.
High awareness, particularly spontaneous is critical to ensuring a robust brand value. It is important that the questions are worded in order to not bias the answers. For example, not having earlier questions priming the brand.
Optimally brands are seeking to be top of mind, and first on the shopping list, otherwise high on the list of brands coming to mind. Some categories will have overall lower levels of awareness across the broader market (e.g niche services); or be more cluttered with some brands with stronger and others will lower levels of awareness and image in the consumers mind.
Tracking of brand awareness through ongoing surveys will typically find consistent brand awareness levels over time unless there has been a change in advertising, media coverage or other strategies impacting visibility for one brand compared with another.
2. Perceptions
Awareness of the brand does not infer a strong brand alone. Often brands are are known to exist, yet are unknown beyond this. When asked to describe the brand, people may simply respond they are “unable to say.”
This may be from a lack of understanding of the products and services offered, or absence of image such as values the brand is known for, and what makes it distinctive to competitors. Such data can be collected in a variety of ways in surveys such as …
“What word (or words) come to mind when you think of brand X?”
This is simplistic, but can allow for analysis and ability to visualise words coming to mind spontaneously, compared with key competitors.
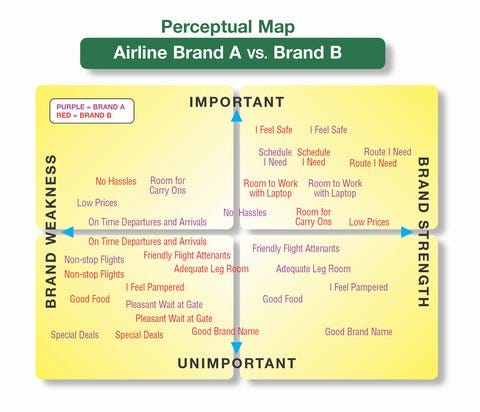
Another more robust way of mapping brand image and comparing against key competitors in the category is to create a perceptual map measuring aspects of brand(s) against scales such as performance and value. The data can then be plotted to provide an image of brand strengths, weaknesses and priorities, compared with category competitors.
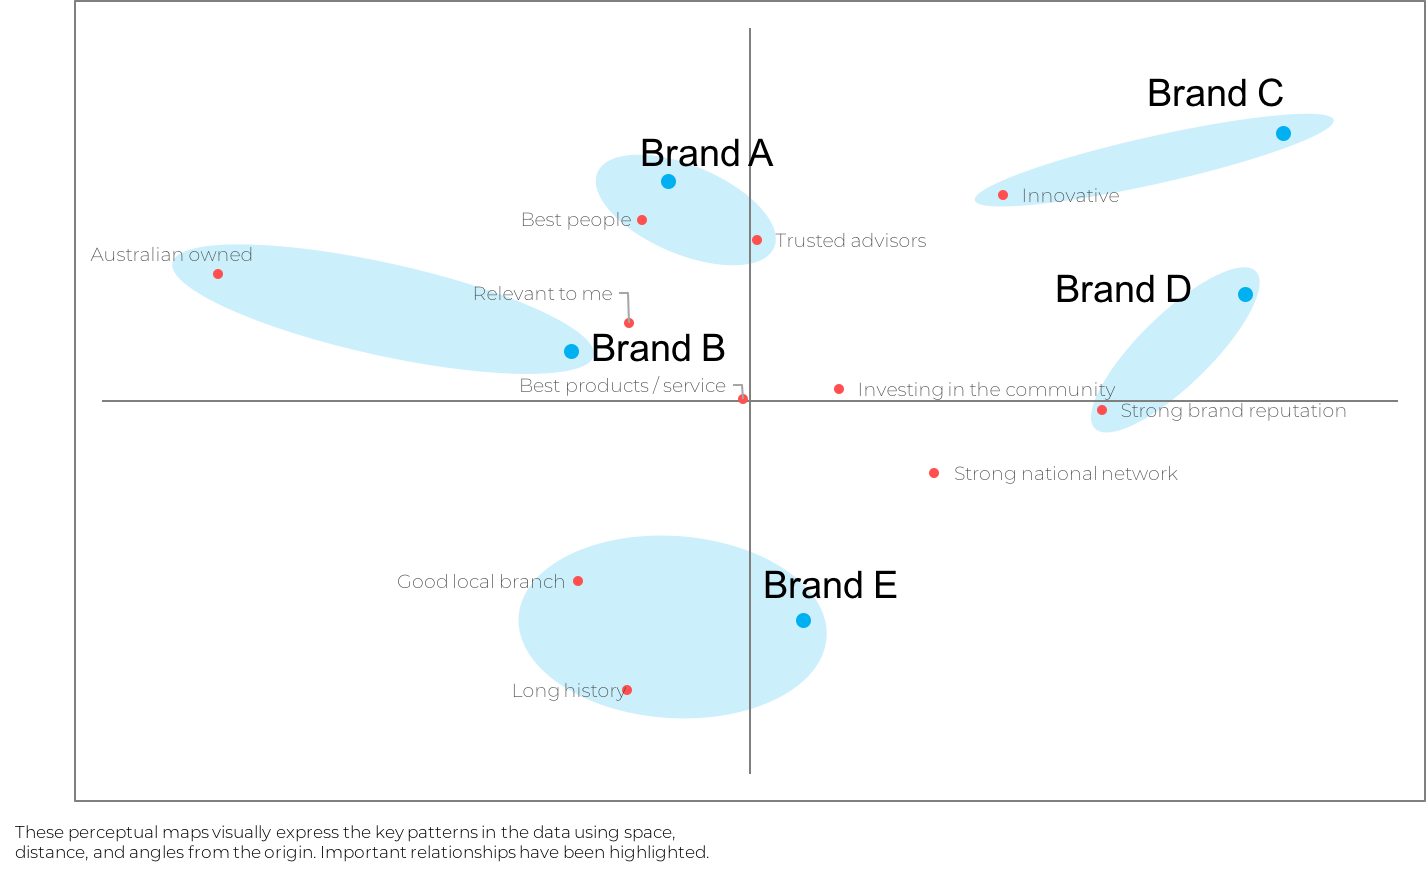
A further common method of mapping brand positioning and the level of category differentiation, is using analysis such as correspondence analysis, an advanced multi-variant statistical technique. A simple explanation is that when applied to brands, correspondence analysis visually plots image attributes (e.g. good value, best quality, innovative, fun, convenient to buy etc) and competing category brands to illustrate …
A. how closely aligned brands are (the closer brands are plotter to each other the more similar);
B. images aligned to brands; and
C. which image attributes are universally held and which others differentiate particular brands (brands sitting closer to the middle are typically more similar to different and/or unknown).
For example, in the visual below, Brand A is more associated by consumers with ‘best people’ and ‘trusted advisors’ and Brand C ‘innovative.’ ‘Best products / services’ is in the centre of the analysis map, is not so much a differentiator for any brand.
Other survey data collection, analysis and visualisation approaches, such as spider plots as visualised below (Each colour in the visual above denotes a different brand), can also be useful to identify brand strengths and gaps.

3. Intentions
Representative surveys of a consumer market are also valuable to measure key indicators such as …
A. intention to buy;
B. willingness to pay more;
C. perceived quality; and/or
D. other key brand measures.
This can be valuable in creating perceptual maps as noted above to plot brands on axis such as willingness to pay more and quality, in order to best understand which brands are price driven vs quality driven for example. Measuring intention to buy and willingness to pay more can also be useful to track over time, allowing the tracking of the brand equity and value over time.
4. Segmentation
Also important in measuring brand equity and value is analysis in different key consumer segments. This may be at a basic level such as easily identifiable demographic segments such as main grocery buyers for a supermarket product; people aged 18–29 for a youth focused product; and/or other target market(s) used for the media and marketing strategy.
However, as noted in our article earlier this year, recommendation is typically analysis via more robust statistical analysis of key segments, and identifying a wider definition of market segments of sufficient size and value to be worth targeting and measuring brand equity and value.
“Cluster analysis is an exploratory data analysis tool which aims at sorting different members of a sample population into groups in a way that the degree of association between those within a segment is maximal if they belong to the same group and minimal otherwise.” More …
Likely brand awareness and other equity measures will be weaker for some segments of consumers not viewing the brand as relevant, yet hopefully it is engaging key valuable target segments. For example, a brand may be less known among price driven consumers, but the market lead among premium quality seeking consumers.
…
This is just a basic summary of the critical role professional surveys can play in measuring brand equity and value, beyond revenue, earnings and assumption. We hope it either reminds you of the fundamentals, confirms what you are doing is correct or makes you think about measuring brand value moving forward.
🙂
You want more? Another most valuable brand list via here.


