“There are many who subscribe to the convention that service is a business cost, but our data demonstrates that superior service is an investment that can help drive business growth. Investing in quality talent, and ensuring they have the skills, training and tools that enable them to empathize and actively listen to customers are central to providing consistently excellent service experiences.” – Jim Bush, EVP American Express
Service quality is an essential aspect of any organisation and is directly related to customer satisfaction. The benefits of superior service delivery to an organisation are significant, with
statistics showing that 77% of consumers think good customer service is critical to earning brand loyalty and generating business and 62% of customers likely to recommend a brand to a friend if provided with great service. However, a high-quality service requires a strategic and dedicated approach to delivery and although the importance is clear, it is not always a top-of-mind factor for businesses.
Data shows that “while 62% of small company leaders in Asia-Pacific agree that customer service is a critical business priority, a surprising 52% report that it’s still not owned by executive leadership. What’s more, only 13% report viewing customer service metrics on a daily basis.” One way to better align organisational thinking about service quality, is through the use of the SERVQUAL model. The SERVQUAL (service quality) model as the name implies, is a framework designed to emphasise the essential linkage between service quality and customer satisfaction. It provides a structure for determining service quality, by assessing the difference between customer expectations and customer perceptions of the service. The model developed in 1988 originally captured ten dimensions, but has since been reduced to five ‘RATER’ dimensions of service quality:
- Reliability: the ability of an organisation to deliver its services reliably, without errors or inconsistencies.
- Assurance: the competence and courtesy of staff, instilling confidence in customers that they are dealing with knowledgeable and trustworthy professionals who can address their needs.
- Tangibles: the physical and visual aspects of service delivery, such as the appearance of facilities, equipment, and personnel. These tangibles contribute to forming customers’ overall perception of the service.
- Empathy: the organisation’s ability to understand and cater to customers’ individual needs. It involves personalised attention, care, and a genuine effort to comprehend customer perspectives.
- Responsiveness: the organisation’s willingness to help customers promptly and efficiently. Quick responses to inquiries and concerns demonstrate an organisation’s commitment to customer satisfaction.
Each area may be considered using a
22 factor questionnaire, involving items such as ‘delivery of service as promised’, ‘willingness to help customers’ and ‘visually appealing facilities’. In practice the tool is used to “ascertain the general expectation of customers using these 22 statements and 22 matching statements to measure customers’ assessment of a specific organisation within the service industry. The response to these statements is generally elicited by way of a 7-point Likert Scale.” Analysis is then conduced to assess the difference between the expectation (i.e., category offerings) and perception (i.e., organisation delivery) of the customers, these being referred to as service gaps. The gaps can often be thought of in one of five ways:
- Knowledge gap: difference between what customers expect of the service and what the organisations understanding of customer needs is.
- Standards gap: difference between managements perception of the quality of service that the customer desires and the steps required to provide that level of service.
- Delivery gap: the difference between the specification of the service and the service that’s being produced by the organisation.
- Communications gap: the difference between what an organisation promises they can deliver and what they are capable of delivering.
- Satisfaction gap: can be considered a combination of the knowledge and communication gaps, being the overall difference between the perceived service by the customer and the experience with delivery of the organisation.
The below table provides an example of how analysis may take place, using the average scores of expectation (E) and perception (P) to determine the gap score (P-E). Thus, allowing the organisation to identify areas where they may be lagging or exceeding in their delivery of service.
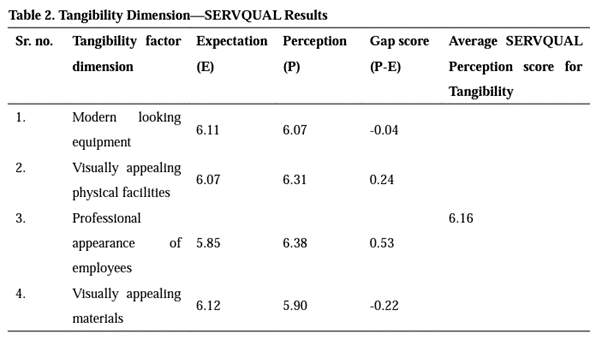
Source: Seema Sharma, Journal of Economics and Public Finance, Vol. 2, No. 1, 2016
This assessment can prove invaluable for an organisation through research providing the opportunity for direct feedback from customers, offering a more transparent view of their experience and attitudes, uncovering insights which aren’t always obvious within an organisation.
Research shows, “although 43 percent of small businesses in Asia-Pacific gave themselves high marks for the quality of their service, what they’re offering is lagging well behind what customers expect. In fact, 68 percent of consumers in the region report that customer service feels like an afterthought for most of the businesses they buy from.” This then lends itself to the development and implementation of evidence-based strategies and continuous monitoring.
“When a customer complains, he is doing you a special favour; he is giving you another chance to serve him to his satisfaction. You will appreciate the importance of this opportunity when you consider that the customer’s alternative option was to desert you for a competitor.” – Seymour Fine, Author The Marketing of Ideas and Social Issues
Ultimately, by thoughtfully implementing the model, organisations can strategically enhance their service quality, leading to benefits such as increased customer loyalty, positive word-of-mouth, and a competitive edge in the market.


